Decision Making
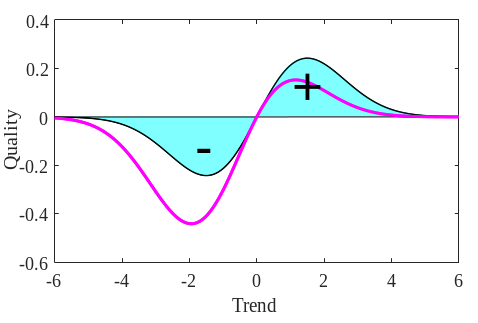
Uncertainty cannot be eliminated, but it can be quantified by rigorous science. Mathematical modeling can then be used to blend scientific uncertainty with the risks and rewards of alternate actions to determine the appropriate course of action.
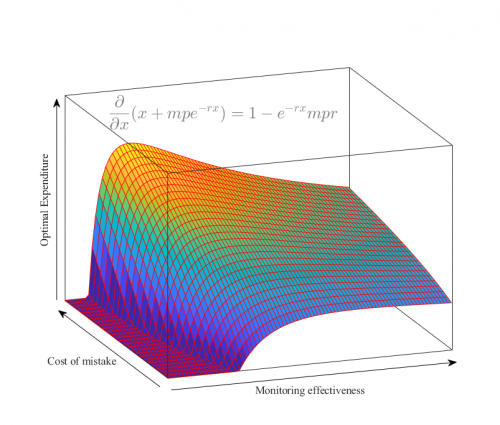
How much should we spend on applied science? Monitoring can be a waste of money if the benefits do not exceed the costs. REDD evaluates decisions about competing monitoring and research needs to ensure that we get the greatest bang for our buck.
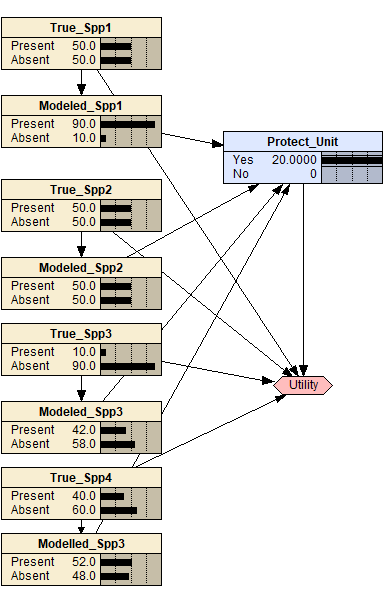
We use Bayesian belief networks to explicitly capture interdependencies and risk tolerances associated with complex decisions. We do this for hatchery management, identification of cold water refugia, and prioritization of fish passage barriers.
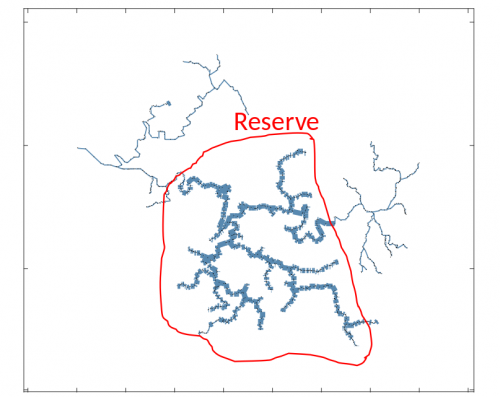
Which features should be included in a biological "reserve" while minimizing landscape fragmentation and meeting budget limitations? The REDD groups is developing end-user software to perform the constrained optimizations needed for reserve planning on stream networks.